


Introduction
Welcome to our in-depth exploration of one of the most common and challenging issues in the world of GraphQL: the notorious n+1 problem. In this blog post, we will delve into the nature of this issue, how it can severely impact production software, and how we can leverage powerful open-source tools like OpenTelemetry, Tempo, and Grafana to effectively identify and debug these n+1 problems.
The GraphQL n+1 Problem
If you're working with GraphQL, you might have encountered the n+1 problem. This issue arises when an application ends up making n+1 queries to fetch data for a particular operation, where n is the number of items in a list, and 1 represents the initial query to fetch the list. This results in a significant number of database hits, which can negatively affect the performance and efficiency of your software, particularly in production environments where high performance is essential.
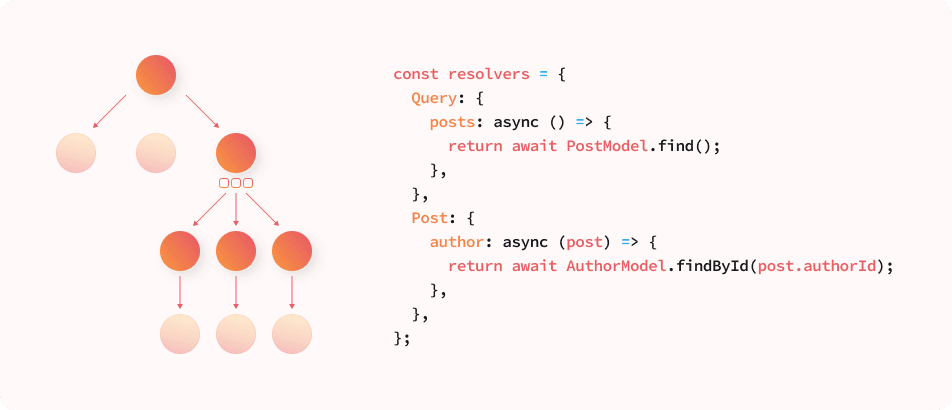
Consider the following GraphQL schema:
1query {
2  posts {
3    id
4    title
5    author {
6      name
7    }
8  }
9}
And we have the corresponding resolvers like this:
1const resolvers = {
2  Query: {
3    posts: async () => {
4      return await PostModel.find();
5    },
6  },
7  Post: {
8    author: async (post) => {
9      return await AuthorModel.findById(post.authorId);
10    },
11  },
12};
In this scenario, when the GraphQL query is executed, it first fetches the list of posts. Then, for each post, it fetches the corresponding author information. This is where the n+1 problem comes into play. If there are n posts, there will be n extra queries to fetch the author information for each post. Therefore, if there are 100 posts, we end up making 101 database queries (1 initial query for posts + 100 queries for each post's author), hence the name "n+1 problem".
The more data we have, the more serious this problem becomes, leading to increased response times, a higher load on the database, and in worst-case scenarios, even causing the application to become unresponsive or fail because of timeouts to obtain a database connection when using connection pooling.
What is Distributed Tracing?
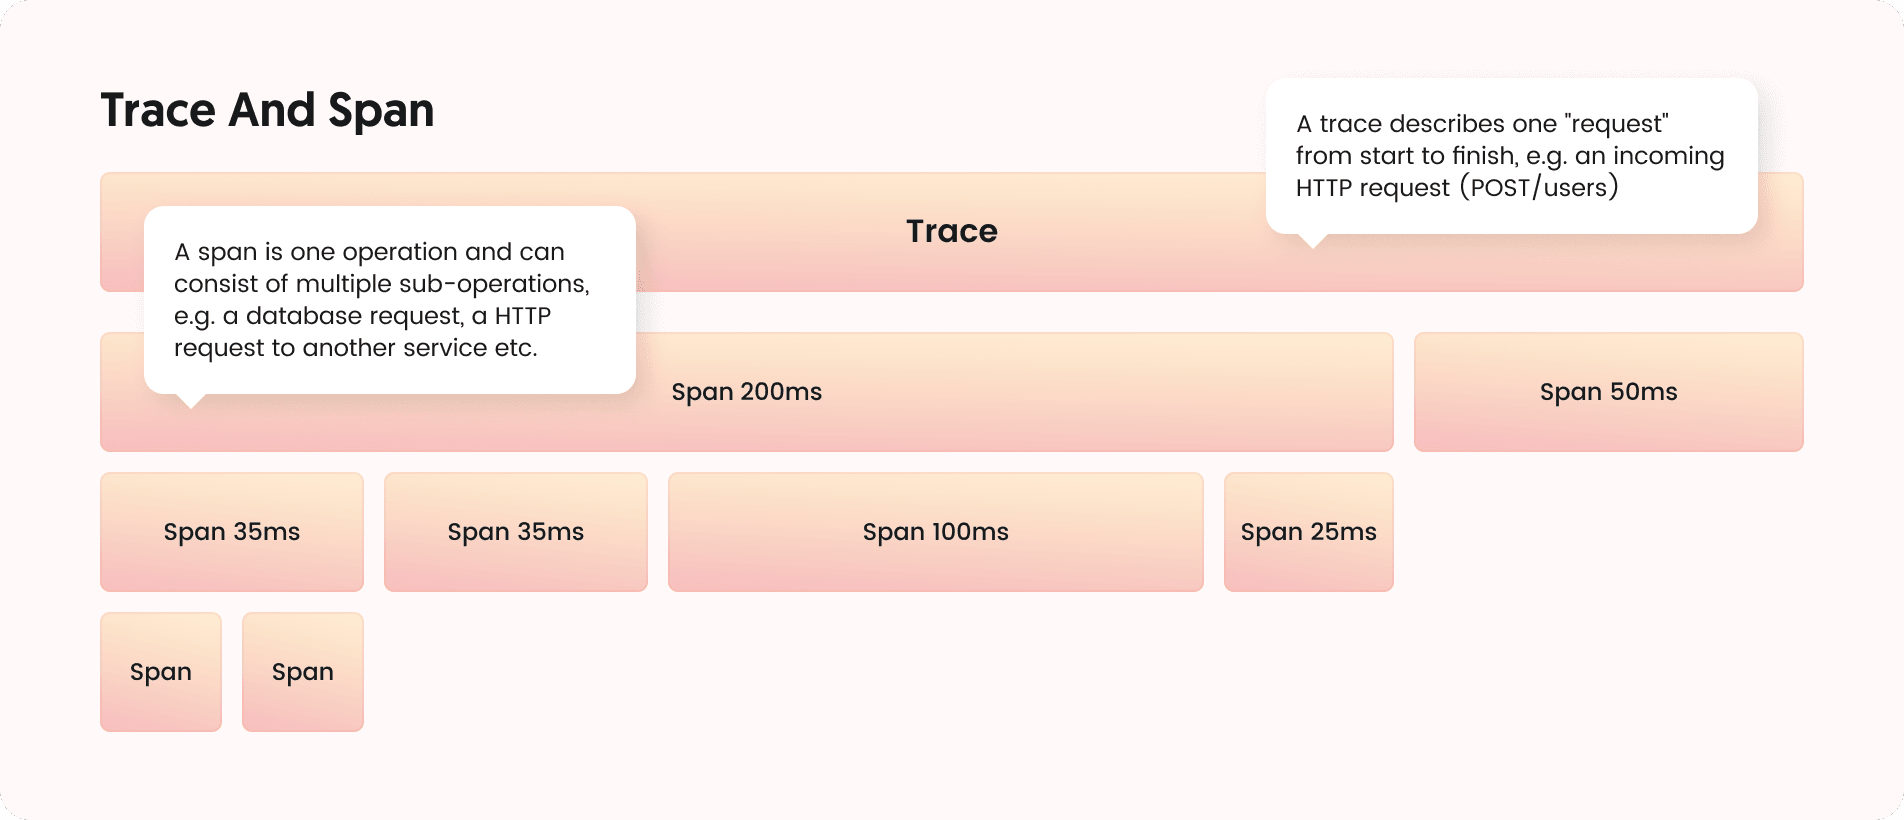
Tracing is a powerful technique that provides insight into the behavior of your applications, enabling you to monitor and optimize performance, and spot and troubleshoot issues like the n+1 problem. Tracing works by tracking requests as they flow through various components of your system. This allows us to see a "trace" of the entire path of a request, providing crucial insights into where time is spent, where failures occur, and more importantly, where optimization is needed.
“Traces” usually consist of several “spans” which represent different operations such as function calls, network requests etc. Each span can again consist of several child spans so that we can get a hierarchical view similar to a flame chart.
Modern tracing tools are usually marketed with terms such as distributed tracing, meaning you can follow a request through different services. This requires each service to be aware of the calling service’s span id, i.e. information must be passed between the services which makes distributed tracing significantly harder to set up.
The same techniques can however be used in monolithic applications as well or you can start instrumenting a single service before moving forward to adding more components.
The Tracing Software Stack
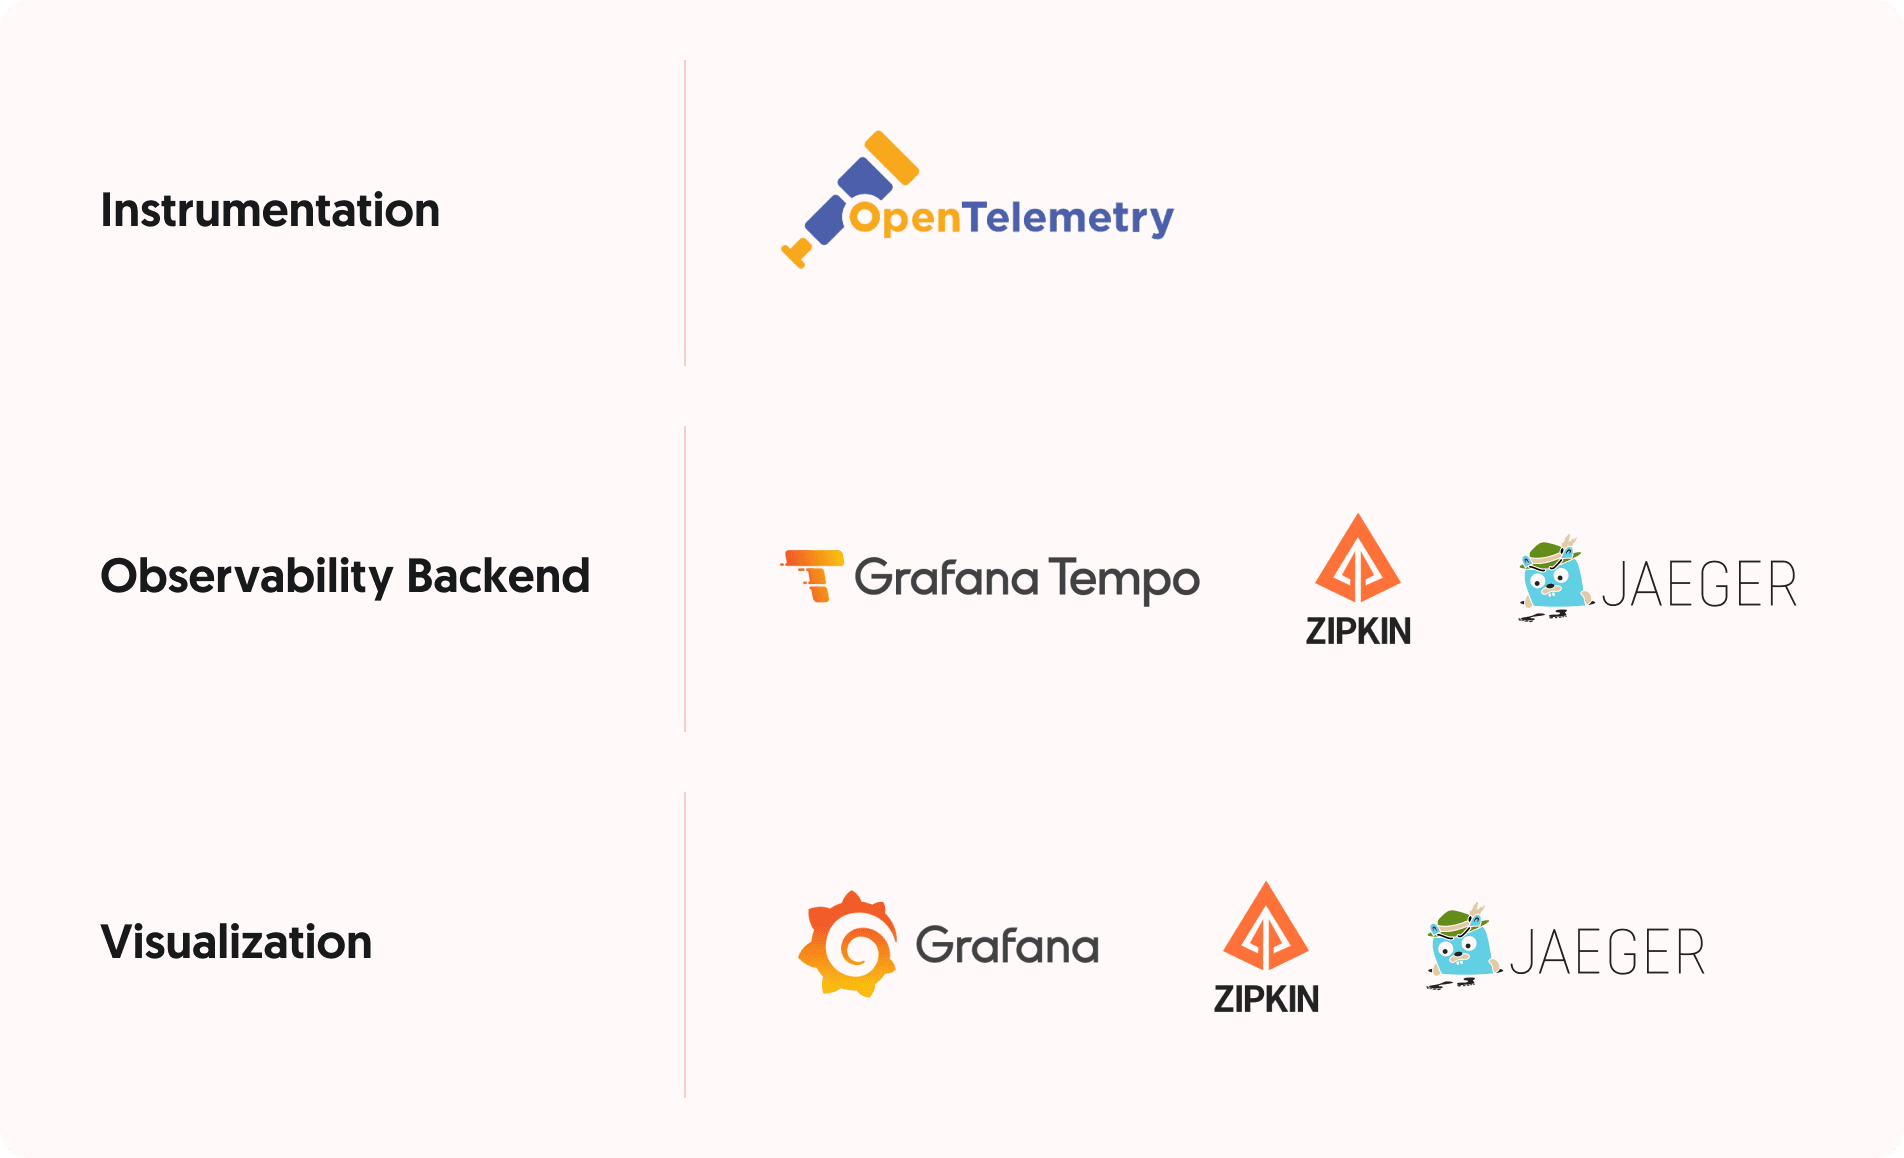
To effectively use tracing on your stack, you will need a minimum of three components: The instrumentation layer that collects tracing information in your application, the observability backend which collects this tracing data, stores it to disk and provides the APIs to search and inspect it and a visualization tool which is sometimes included with the backend and sometimes distributed separately.
While numerous SaaS solutions are available in the backend and visualization space, we will focus on open source self-hostable software here as that gives you the freedom to explore it without any account sign ups or fees.
Running a tracing stack at scales comes with its own challenges, but you can always switch to a hosted solution later once you understand the basics.
Running The Stack Locally Using docker-compose
We will now set up an example stack locally by adding OpenTelemetry to an existing Node.JS application (we assume that you have an existing application that you would like to instrument) and set up a backend and visualization layer.
To make local testing easier, we use docker-compose to run both our application and the tracing tools. A basic knowledge of Docker and docker-compose will be required to follow along.
In this post, we will be using Grafana’s Tempo as the backend (without its optional Prometheus and Loki integrations, those will be addressed in a separate post) and Grafana as its frontend.
To get started, a docker-compose.yml file must exist in the project root that includes not only our application, but also Tempo and Grafana. An example file (loosely based on the examples provided by Grafana but without Prometheus) could look like this:
1version: '2'
2services:
3    backend:
4        build:
5            context: .
6        environment:
7            NODE_ENV: development
8            TRACING_HOST: tempo
9            TRACING_PORT: '6832'
10        ports:
11            - '5000:5000'
12        links:
13            - tempo
14
15   tempo:
16      image: grafana/tempo:latest
17      command: [ "-config.file=/etc/tempo.yml" ]
18      volumes:
19        - ./tempo.yml:/etc/tempo.yml
20
21    grafana:
22        image: grafana/grafana:9.5.1
23        ports:
24            - 3000:3000
25        volumes:
26            - grafana-storage:/var/lib/grafana
27
28volumes:
29    grafana-storage:
We will also need a tempo.yml configuration file to provide some settings to Tempo:
1server:
2  # This is the API port which Grafana uses to access Tempo traces
3  http_listen_port: 3200
4
5distributor:
6  receivers:
7    jaeger:
8      protocols:
9        # Enable only the thrift binary protocol which will be used by our Jaeger ingestor
10        # on port 6832
11        thrift_binary:
12
13compactor:
14  compaction:
15    block_retention: 1h                # overall Tempo trace retention. set for demo purposes
16
17storage:
18  trace:
19    backend: local                     # backend configuration to use
20    wal:
21      path: /tmp/tempo/wal             # where to store the the wal locally
22    local:
23      path: /tmp/tempo/blocks
Note that we do not enable persistent storage of Tempo traces to avoid filling up the local hard drive. When you restart Tempo, your previously collected traces will be gone.
Adding OpenTelemetry to Your Application
The OpenTelemetry JavaScript SDK, in particular, is designed to work with Node.js and web applications. It comes with various modules that can be loaded depending on the application stack you want to instrument. These modules are classified into several categories:
- API Packages: These provide the interfaces and classes necessary to interact with OpenTelemetry. They allow manual instrumentation and interaction with context, metrics, and traces. The base module is @opentelemetry/api.
- SDK Packages: These implement the APIs and are responsible for managing and collecting telemetry data. These include the core SDK (@opentelemetry/core), tracing SDK (@opentelemetry/tracing), metrics SDK (@opentelemetry/metrics), and others.
- Instrumentation Packages: These are modules that are specifically designed for various popular libraries and frameworks, such as Express (@opentelemetry/instrumentation-express), HTTP (@opentelemetry/instrumentation-http), gRPC (@opentelemetry/instrumentation-grpc), and GraphQL (@opentelemetry/instrumentation-graphql). By loading these modules, you can automatically instrument your application without needing to manually add tracing code.
- Exporter Packages: Exporters are responsible for sending the telemetry data to your backend of choice. OpenTelemetry provides several exporter packages for popular backends, including Jaeger (@opentelemetry/exporter-jaeger), Zipkin (@opentelemetry/exporter-zipkin), and Prometheus (@opentelemetry/exporter-prometheus).
Using a combination of these packages, we can quite easily add instrumentation to our application without wondering about hooking into the various different libraries.
Here is some real-life example code that can just be loaded on application startup and will automatically collect traces of your GraphQL + PostgreSQL application as well as send them to Tempo via the Jaeger exporter:
1import * as opentelemetry from '@opentelemetry/sdk-node';
2import { JaegerExporter } from '@opentelemetry/exporter-jaeger';
3import { Resource } from '@opentelemetry/resources';
4import { SemanticResourceAttributes } from '@opentelemetry/semantic-conventions';
5import { diag, DiagConsoleLogger, DiagLogLevel } from '@opentelemetry/api';
6import { HttpInstrumentation } from '@opentelemetry/instrumentation-http';
7import { ExpressInstrumentation } from '@opentelemetry/instrumentation-express';
8import { GraphQLInstrumentation } from '@opentelemetry/instrumentation-graphql';
9import { PgInstrumentation } from '@opentelemetry/instrumentation-pg';
10
11if (process.env['JAEGER_HOST']) {
12    // For troubleshooting, set the log level to DiagLogLevel.DEBUG
13    diag.setLogger(new DiagConsoleLogger(), DiagLogLevel.INFO);
14
15    const sdk = new opentelemetry.NodeSDK({
16        traceExporter: new JaegerExporter({
17            host: process.env['JAEGER_HOST'],
18            port: Number(process.env['JAGER_PORT']) || 6832,
19        }),
20        instrumentations: [
21            new HttpInstrumentation(),
22            new ExpressInstrumentation(),
23            new GraphQLInstrumentation({
24                mergeItems: true,
25                ignoreTrivialResolveSpans: true,
26            }),
27            new PgInstrumentation(),
28        ],
29        resource: new Resource({
30            [SemanticResourceAttributes.SERVICE_NAME]: 'backend',
31            [SemanticResourceAttributes.DEPLOYMENT_ENVIRONMENT]:
32                process.env.NODE_ENV,
33        }),
34    });
35
36    sdk.start();
37}
Of course the imported OpenTelemetry packages will need to be installed using npm or yarn:
1npm i -S @opentelemetry/sdk-node @opentelemetry/exporter-jaeger @opentelemetry/instrumentation-http @opentelemetry/instrumentation-express @opentelemetry/instrumentation-graphql @opentelemetry/instrumentation-pg
Viewing Traces in Grafana
Finally once the setup has been completed, you can launch your project using docker-compose up. This should start your application as well as Tempo and Grafana and make Grafana accessible for you on http://127.0.0.1:3000.
Grafana needs to be configured and connected to Tempo on its first launch.
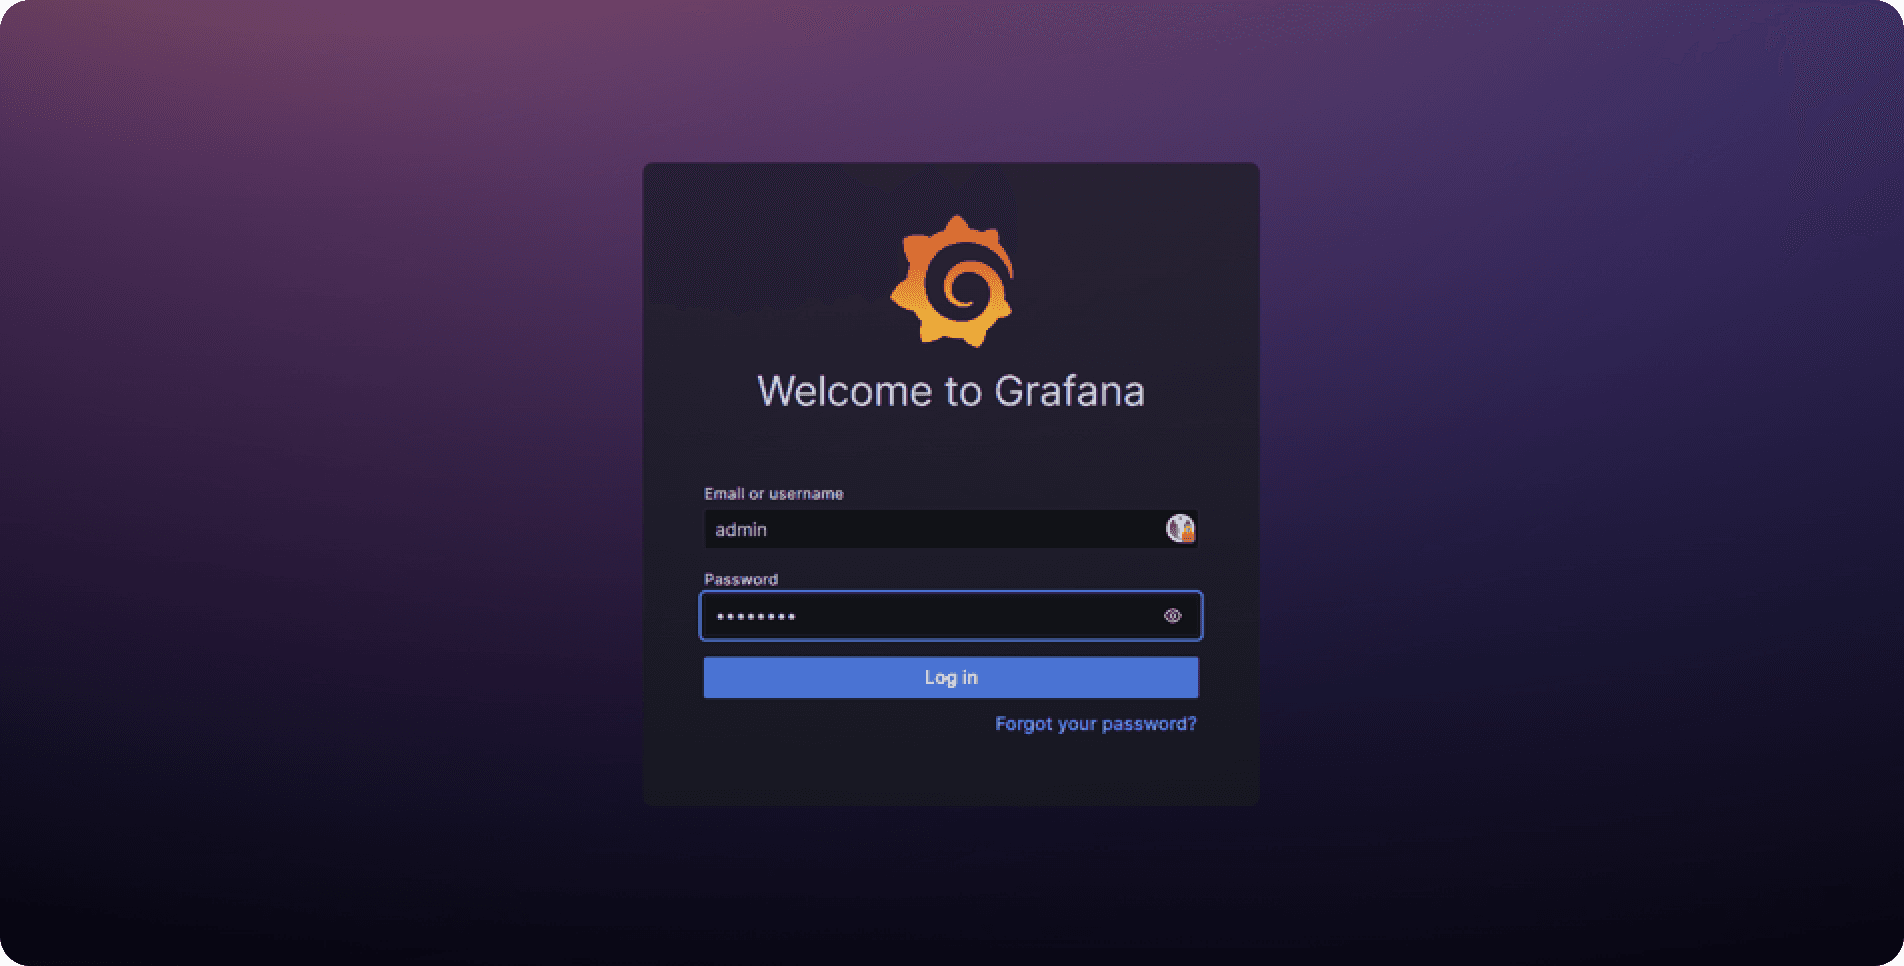
First, sign into it using the default username/password combination admin:password:
Grafana will now ask you to set a new password. Make sure to remember it or note it down as it will be persisted across restarts.
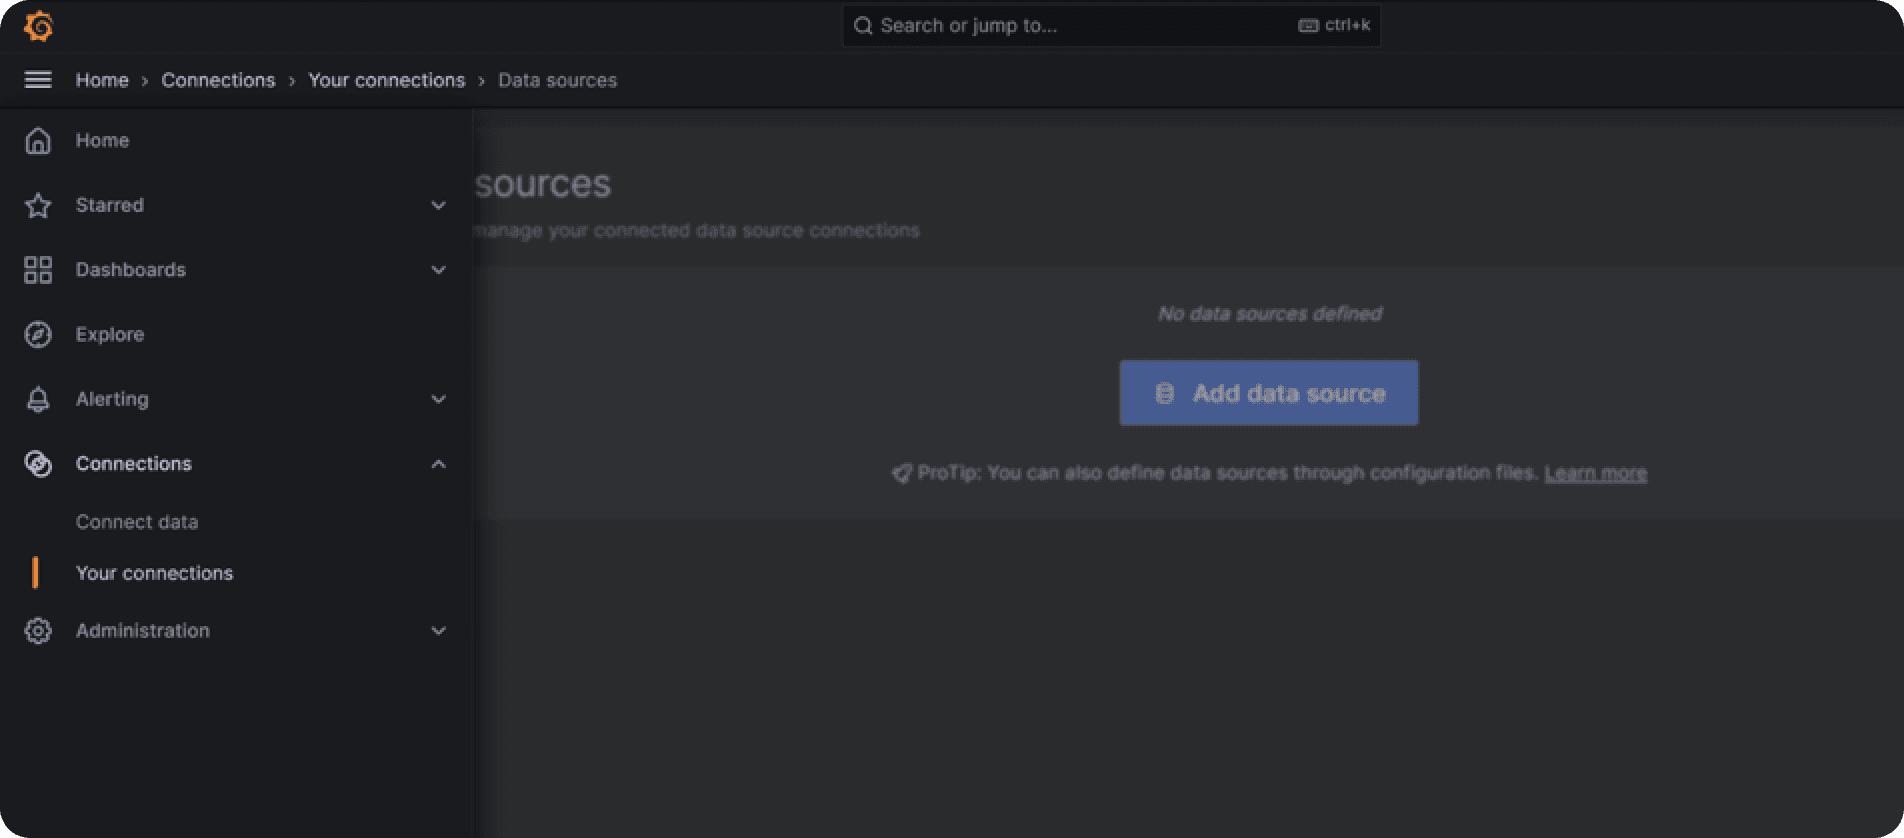
Next, open the sidebar menu to navigate to “Connections -> Your connections” and click “Add data source”:
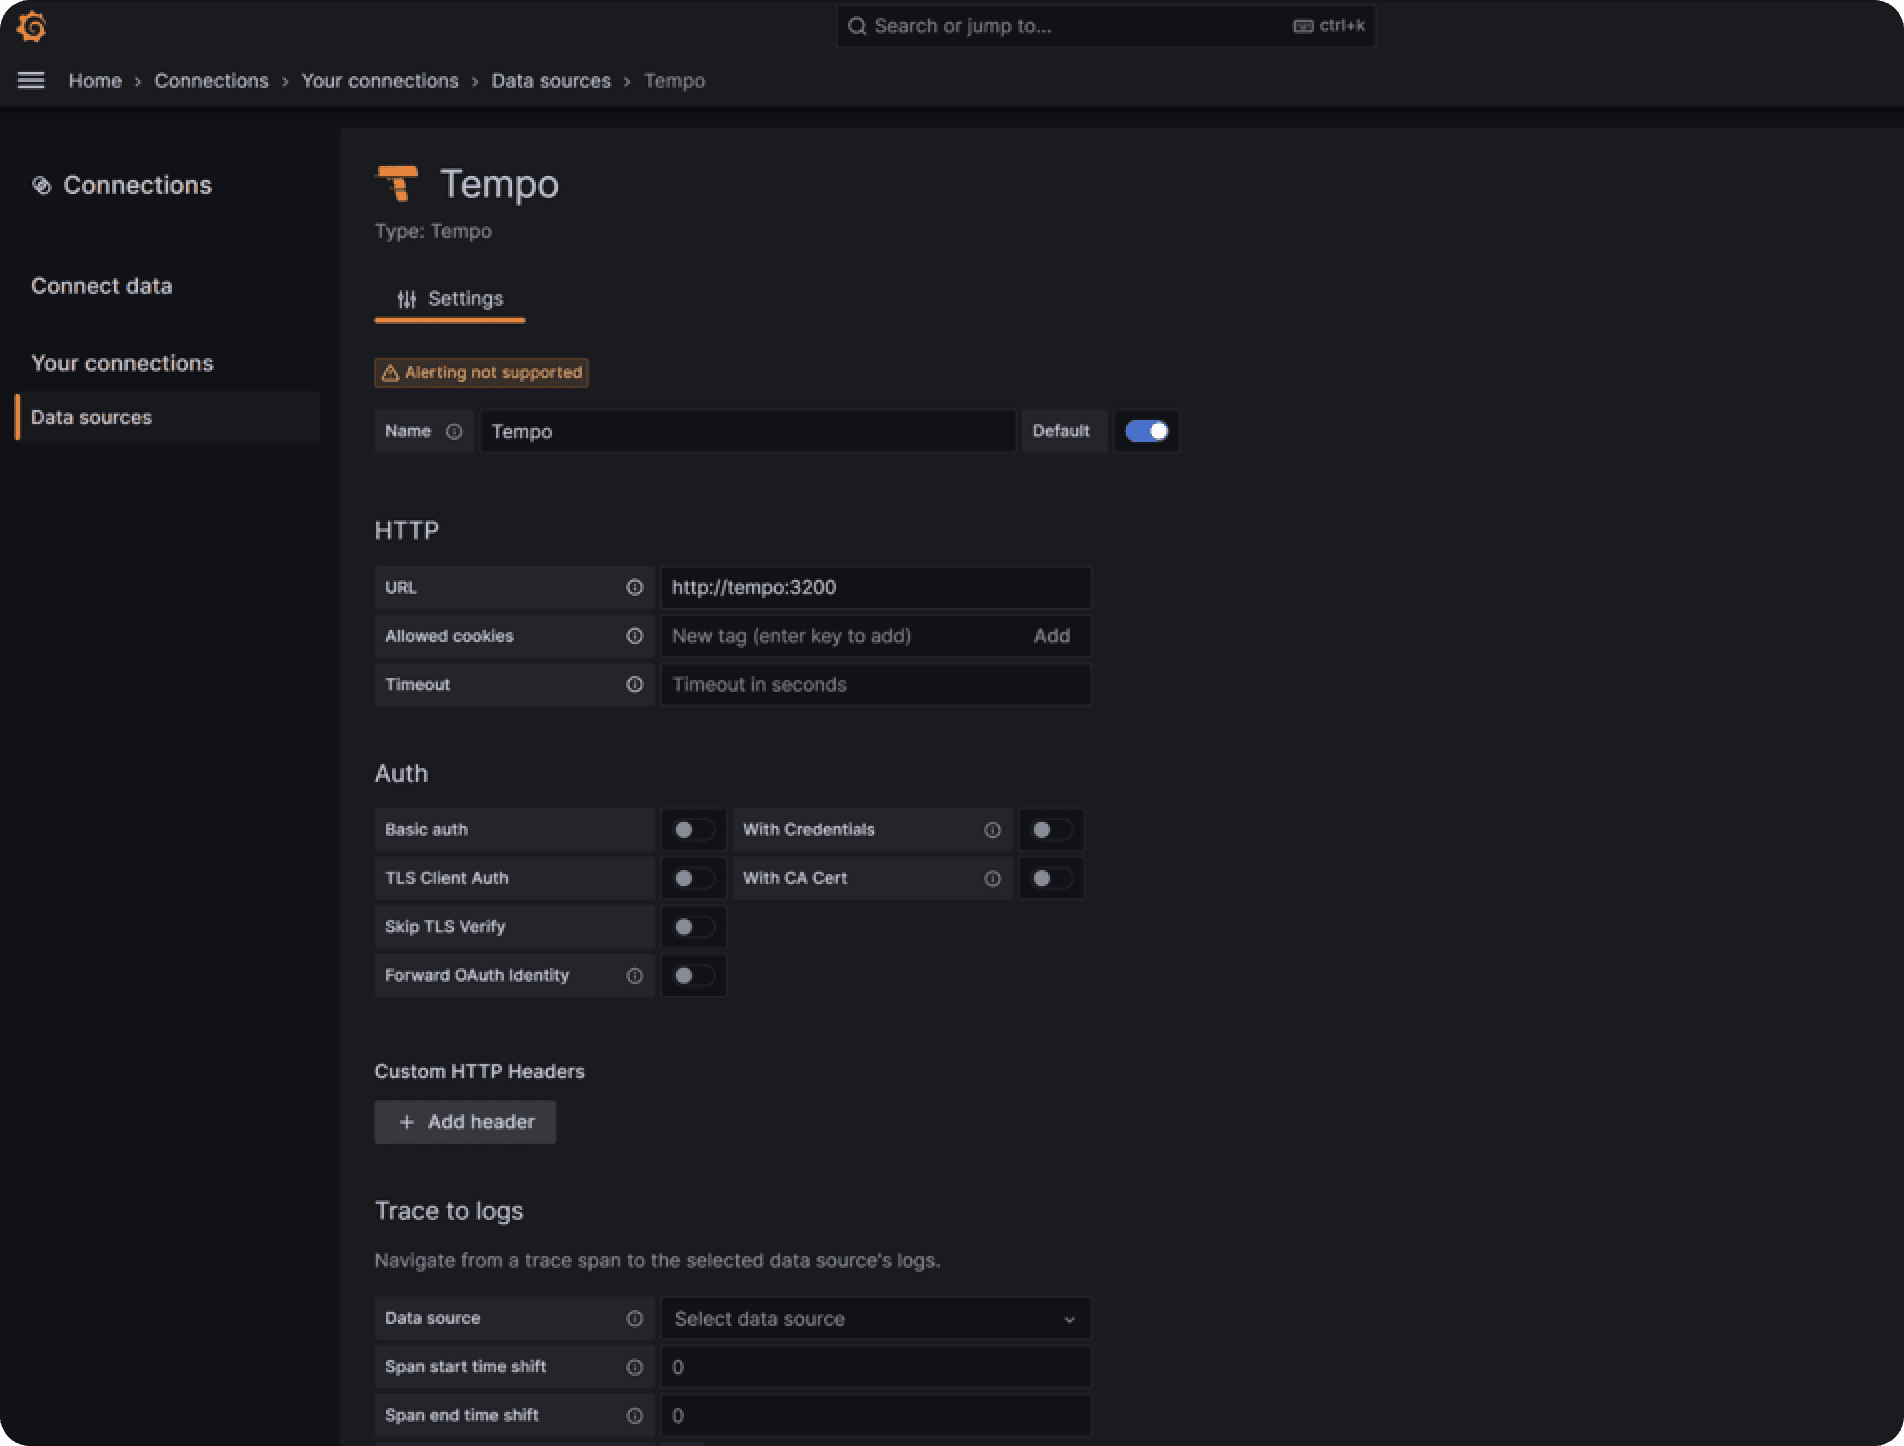
From the list, select “Distributed tracing -> Tempo” and on the following page set the URL parameter to http://tempo:3200. Leave all other settings unsure and click “Save & test”. Make sure the connection attempt succeeds.
You have now successfully connected Tempo to Grafana. Next, open the sidebar menu again and click “Explore”. On the top of the screen, you will see a dropdown which is the data source selection. It should have “Tempo” preselected.
Next, make a GraphQL request (ideally the one you want to inspect for the n+1 problem) to your backend to collect some tracing data.
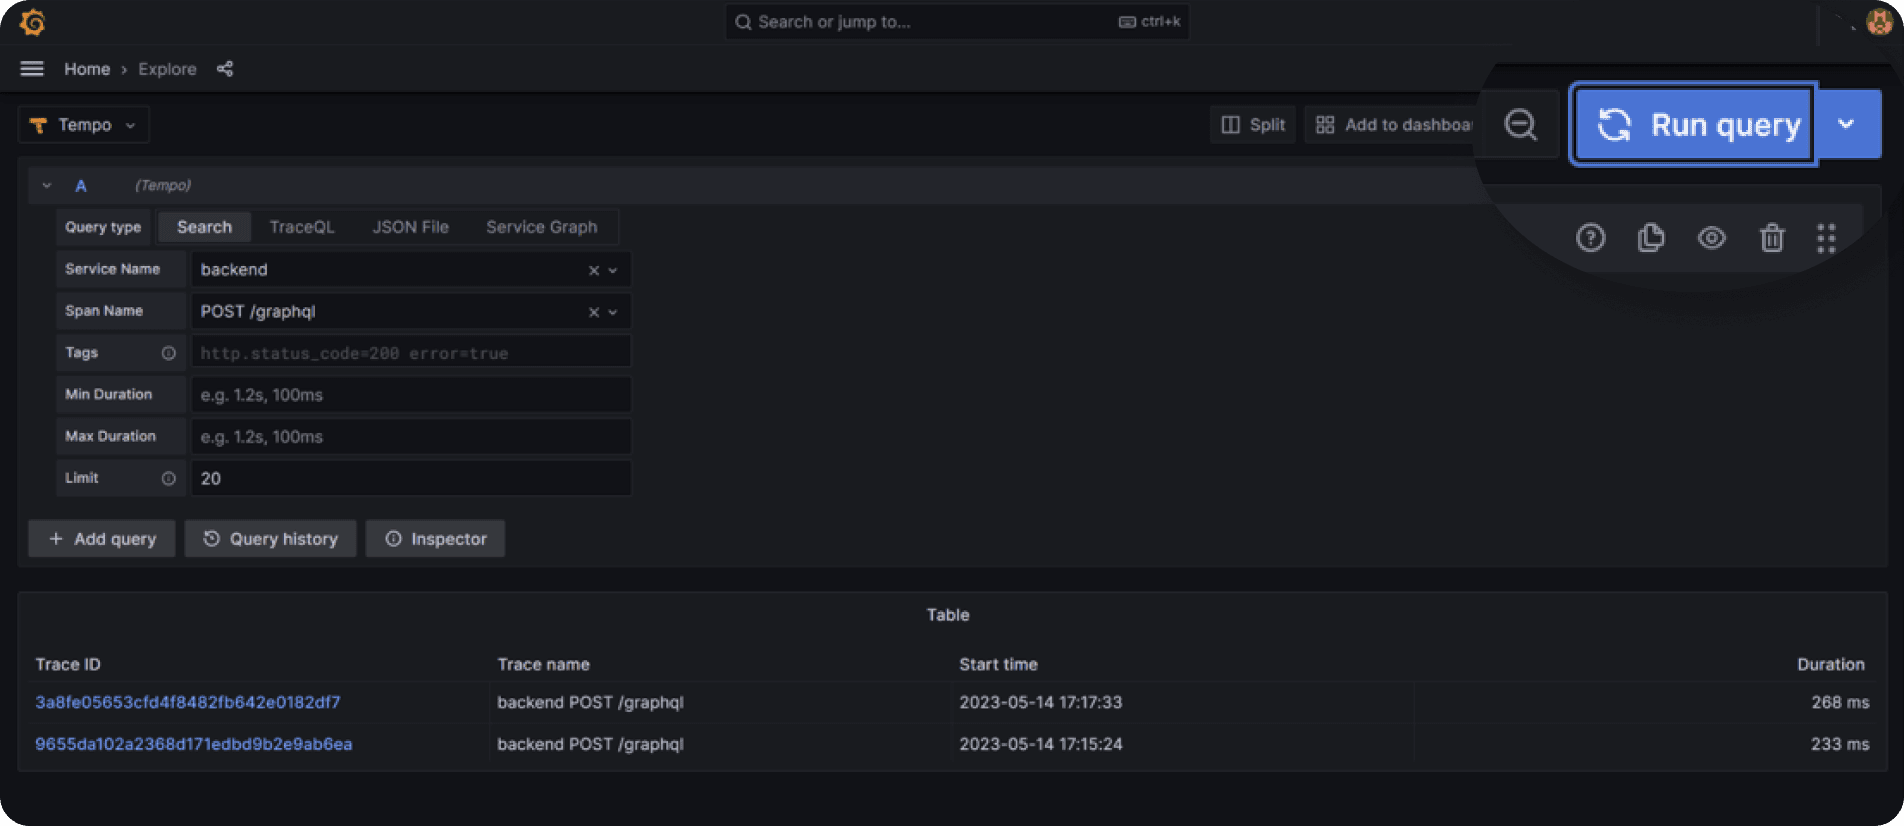
If everything is properly configured, you can now select “Search” under the “Query type” selector and will find your service’s name in the dropdown.
To inspect your GraphQL request, select “POST /graphql” under Span Name and click the blue “Run query” button on the top right of the screen.
Depending on how many requests you made, you should find a list of traces that have been collected:
Identifying n+1 Problems Using Traces
You can now select one of the traces and dig into it. You will see each operation and all of its sub-operations as spans which can be folded and unfolded. The first few operations will likely be HTTP processing and potentially express middleware executions. Further down, you will then see your resolvers and ultimately database queries.
To identify n+1 problems, you are looking for qraphql.resolve spans that have a lot of database operations under them.
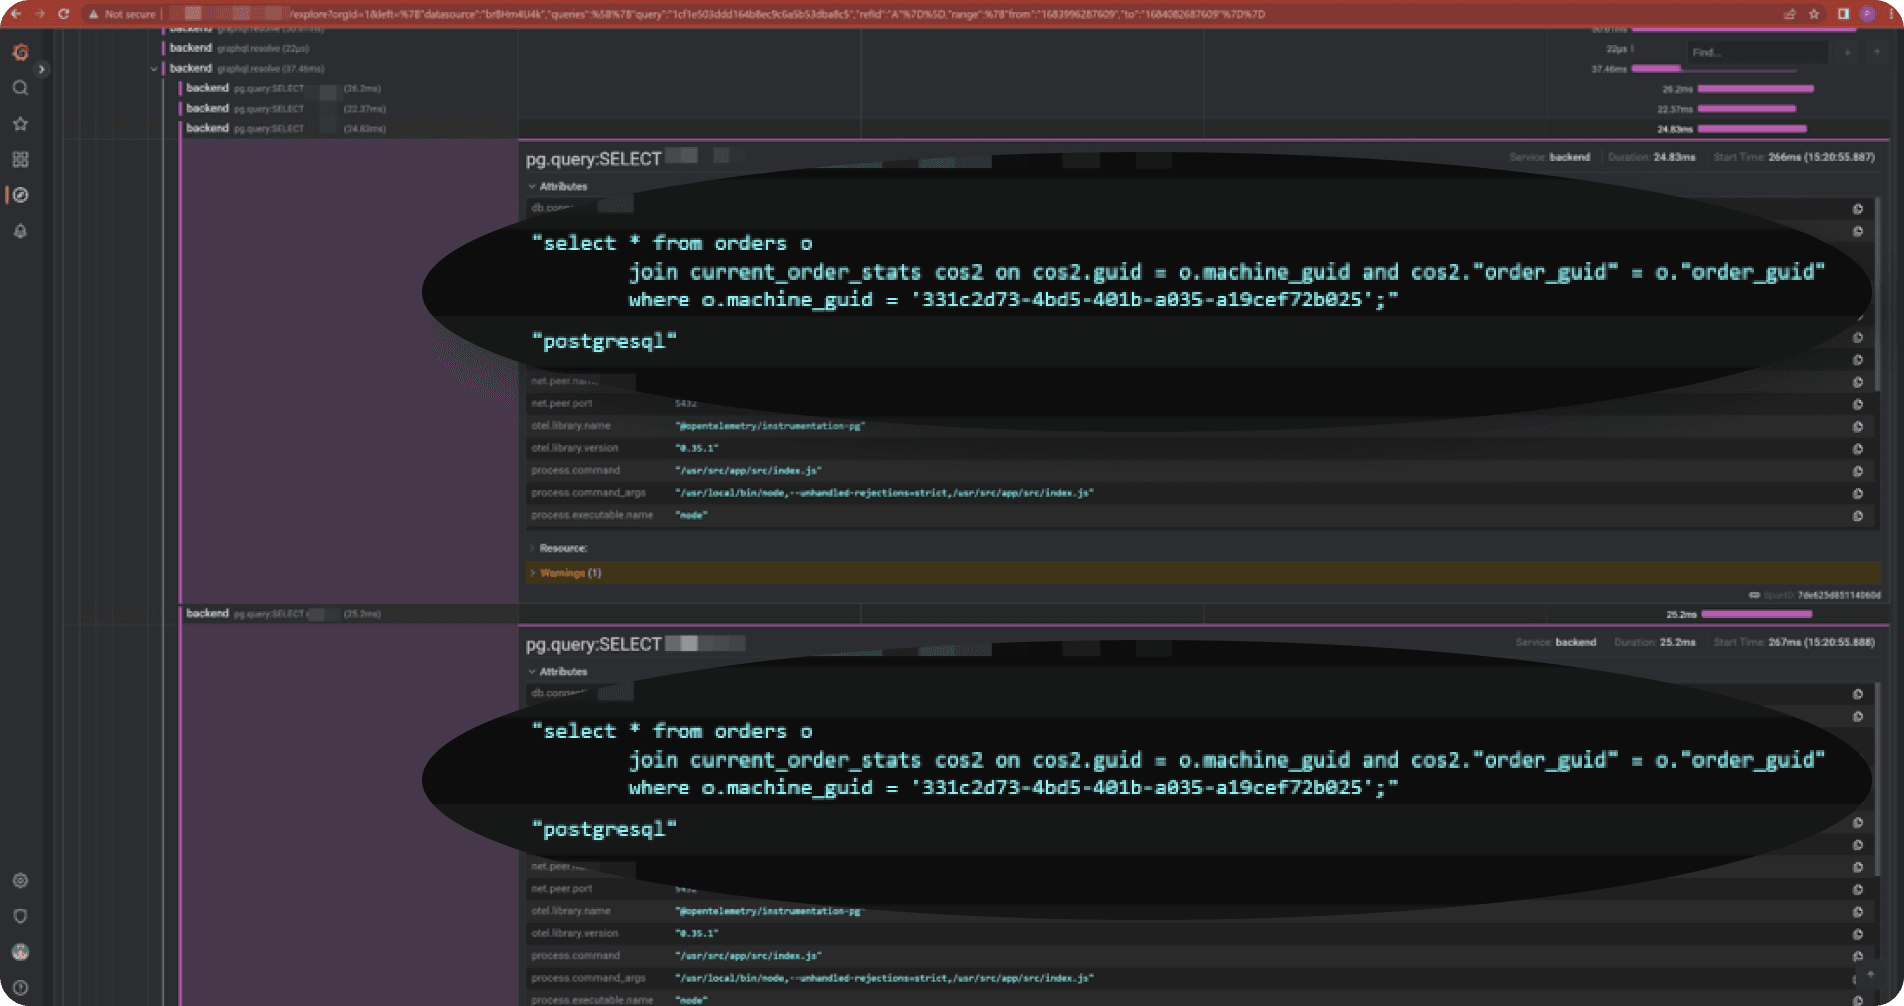
This example is taken from an actual production application we run. Here you can see that the resolver has several database operations and if we compare the db.statement attributes, we see that they differ only in the machine_guid parameter.
That’s almost a textbook example which could be avoided using e.g. data loaders or prefetching via JOINs.
What's Next?
Having this tracing setup now in place, it can be used for much more than just debugging n+1 problems. It can identify long-running database queries, slow HTTP requests and even errors which will be marked with the error=true tag in the span.
When rolling this out to production, keep in mind however that collecting traces and storing them comes at a cost so that you usually want to instrument only a subset of all requests. This is referred to as “sampling”.
Sampling is a critical aspect of distributed tracing, as it controls which traces are recorded and sent to your backend. The three main strategies are "Always-On", where all traces are recorded; "Always-Off", where no traces are recorded; and "Probability", where a certain percentage of traces are recorded based on a specified probability. There's also "Rate Limiting" sampling, which limits the number of spans recorded per minute. While it may seem ideal to record every trace, in a production-grade application, the sheer volume of requests can be overwhelming, leading to excessive resource usage (CPU, memory, network bandwidth) and high costs associated with storing and analyzing this data. Moreover, collecting every trace could potentially introduce latency in your application due to the added overhead. Hence, a balance needs to be struck to collect a representative sample of traces that provide meaningful insights while ensuring the performance and cost-effectiveness of your tracing setup.
In one of our next posts, we will explore how to integrate this setup with Prometheus and Loki to get a full picture of every single request, so stay tuned.

